Views and charts are an important part of the User Interface in Asset Insider assisting the user in better understanding the data they work with. In this article we will go through the different kinds of Views and Charts.
Views
Let’s clarify what the Views mean:
Views are special saved queries that retrieve data by using a specific filter. They also contain information about how the data in the view should be displayed in the application. It is important to know that there are two types of views – User Query and Saved Query.
User Query - A User Query, called a Saved View in the application, can be created by the user, it is owned by an individual user (other than the creator), can be assigned, and shared with other users, and can be viewed by other users depending on the query's access privileges.
Saved Query - A Saved Query, called a View in the application, is owned by an organization making it visible to all users in the organization.
Saved Query or a View in the application could be created only by system administrators.
In Power Apps, views define how rows for a specific table are displayed. A view defines the following:
- The columns (attributes) to display
- The width of the columns
- How the rows are sorted by default
- Which filters are applied to determine which rows appear in the list by default
The rows that are visible in individual views are displayed in a list, which frequently provides options so people could change the default sorting, column widths, and filters to more easily see the data that is important to them. Views also define the data source for charts that are used in the application.
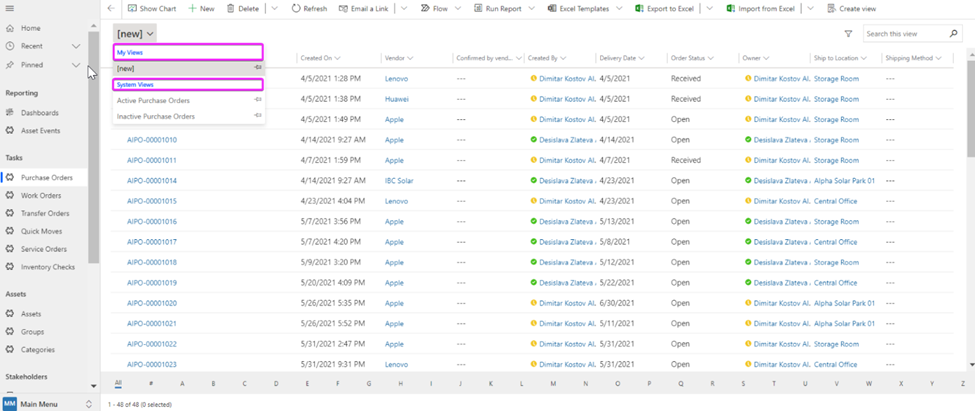
Personal Views
Personal views are owned by individuals, and, because of their default User level access, they are visible only to that person or anyone else they choose to share their personal views with.
While you can create a new personal view based on a system or public view, you cannot create a system or public view based on a personal view. This can only be performed by the system administrator only – import a user view as a system one.
System Views
As a system administrator or system customizer, you can edit system views.
System views are special views the application depends on, which exist for system tables or are automatically created when you create custom tables. These views have specific purposes and some additional capabilities. System views are owned by the organization so that everyone can see them. For example, everyone has organization-level access to read rows for the View (saved query) table. These views are associated with specific tables and are visible within the solution explorer. You can include these views in solutions because they are associated with the table.
- Quick Find - The default view used when searches are performed using Quick Find. This view also defines which columns are searched when using search capabilities of Quick Find and Lookup views.
- Advanced Find - The default view used to display results when using Advanced Find. This view also defines the columns used by default when new custom public views or personal views are created without defining a view to use as a template.
- Associated - The default view that lists the related tables for a row.
- Lookup - The view you see when you select a row to set for a lookup column.
These views are not shown in the view selector, and you can't use them in sub lists in a form or as a list in a dashboard. You cannot delete or deactivate these views.
Public Views
Public views are general purpose views that you can customize as you see fit. These views are available in the view selector, and you can use them in sub-grids, in a form, or as a list in a dashboard.
Some public views exist by default for system tables and for any custom table. For example, when you create a new custom table, it will have the following combination of public and system views.
|
Name |
Type |
|
Active table plural name |
Public |
|
Inactive table plural name |
Public |
|
Quick Find Active table plural name |
Quick Find |
|
table name Advanced Find View |
Advanced Find |
|
table name Associated View |
Associated |
|
table name Lookup View |
Lookup |
You can create custom public views. You can delete any custom public views you create in an unmanaged solution. You cannot delete any system-defined public views. Custom public views added by importing a managed solution may have managed properties set that can prevent them from being deleted, except by uninstalling the managed solution.
Customize Views
As a system customizer you can customize the views through controls by making grids (lists) editable and compatible for Unified Interface. The following controls are used:
- Editable Grid: Allows users to do rich in-line editing directly from grids and sub-grids whether they are using a web app, tablet, or phone. More information: Make grids editable using the Editable Grid custom control
- Read Only Grid: Provides users an optimal viewing and interaction experience for any screen size or orientation such as mobiles and tablets by using responsive design principles.
Charts
The meaning of the Charts in Asset Insider
It is important to understand that Charts depend on the Views. Charts/Visualizations let you see your business data graphically. A visualization is attached to a table in Microsoft Dataverse. You can attach multiple visualizations to a table, however, only one visualization can be displayed at a time along-side a grid. You can view multiple visualizations at the same time by using a dashboard.
Charts display data visually by mapping textual values on two axes: horizontal (x) and vertical (y). The x axis is called the ‘category axis’ and the y axis is called the ‘series axis’. The category axis can display numeric as well as non-numeric values whereas the series axis only displays numeric values.
- Single-series charts: Charts that display data with a series (y) value mapped to a category (x) value.
- Multi-series charts: Charts that display data with multiple series values mapped to a single category value. Multi-series charts include stacked column charts, which vertically display the contribution of each series to a total across categories, and 100% stacked column charts, which compare the percentage that each series contributes to a total across categories. You can combine different compatible chart types in multi-series charts, for example, column and line, bar, and line, and so on.
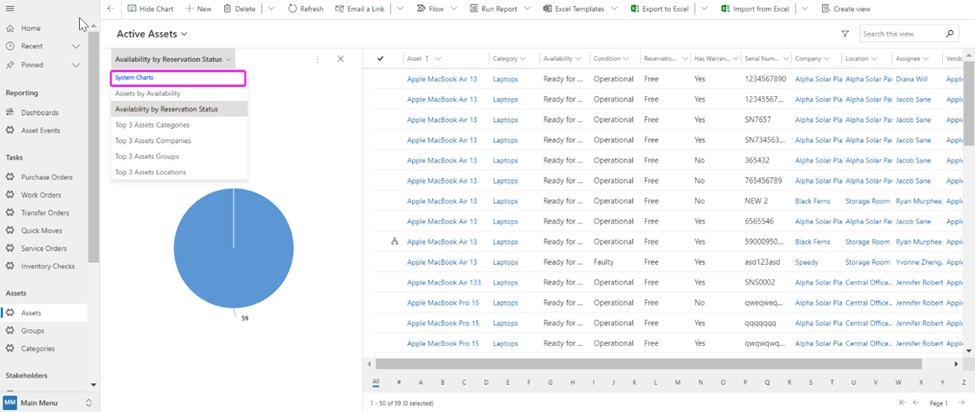
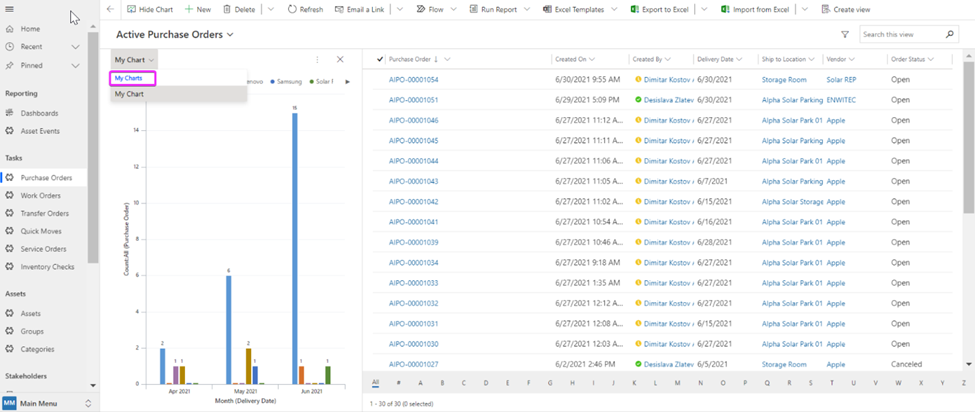
Charts and Ownership
There are two types of visualization ownership: organization-owned and user-owned.
- An organization-owned visualization is owned by an organization they are available for all users and cannot be assigned or shared.
- A user-owned visualization is owned by an individual user and can be assigned and shared with other users and teams.
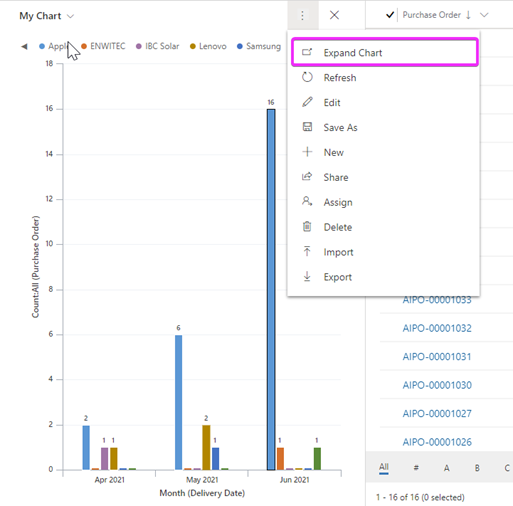
Charts can filter the information in the view. This can be done by clicking on one of the bars (Or on a part of the chart, because in this case it is bar chart). There is an available option ‘Drill Down by’. You can drill down into a segment on a chart and filter the data for that segment. When a chart is shown together with grid, the drill-down option that you select will filter both chart and grid.
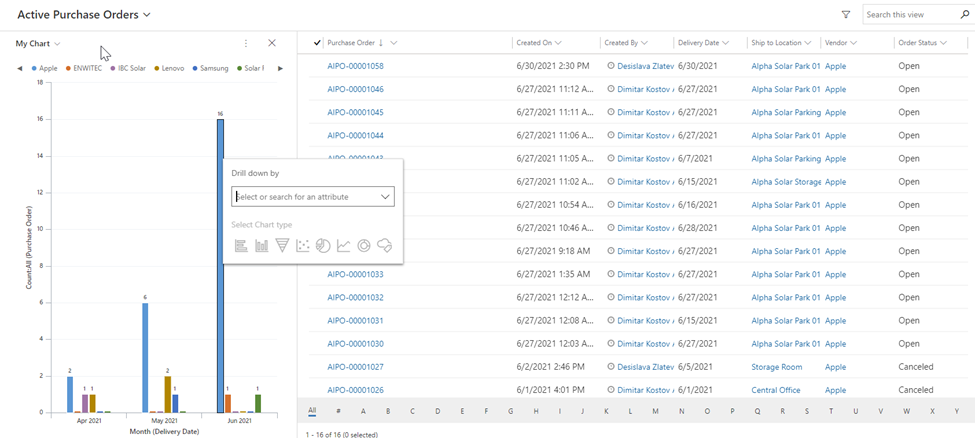
There is an option to Expand the Chart.